[My Journey to CCIE Automation #7] Exploring Model-Driven Telemetry for Real-Time Network Insights
My journey continues
👋 Hi, I’m Bjørnar Lintvedt
I’m a Senior Network Consultant at Bluetree, working at the intersection of networking and software development.
As mentioned in my first blog post, I’m preparing for the CCIE Automation lab exam — Cisco’s most advanced certification for network automation and programmability. I’m documenting the journey here with weekly, hands-on blog posts tied to the blueprint.
Blog post #7
This week I wanted to dive deeper into Model-Driven Telemetry (MDT). Instead of manually polling devices for operational data, MDT allows streaming real-time metrics from network devices to monitoring systems — giving insights into performance, state, and anomalies as they happen.
Why Model-Driven Telemetry?
Model-Driven Telemetry is the foundation for proactive, data-driven network operations. It lets us:
-
Stream metrics from devices in real-time (CPU, memory, interfaces, BGP peers)
-
Use YANG models to define exactly what data we want
-
Choose between periodic polling, periodic push, or event-driven subscriptions
-
Visualize data in Grafana or feed it into analytics platforms
This Week’s Project
I created a MDT solution for Cisco IOS-XE devices, integrated into my Nautix platform:
-
Subscriptions: Created using YANG models to collect CPU, memory, temperature and CDP neighbors operational data
-
Streaming: Configured dial-out gRPC telemetry to Telegraf
-
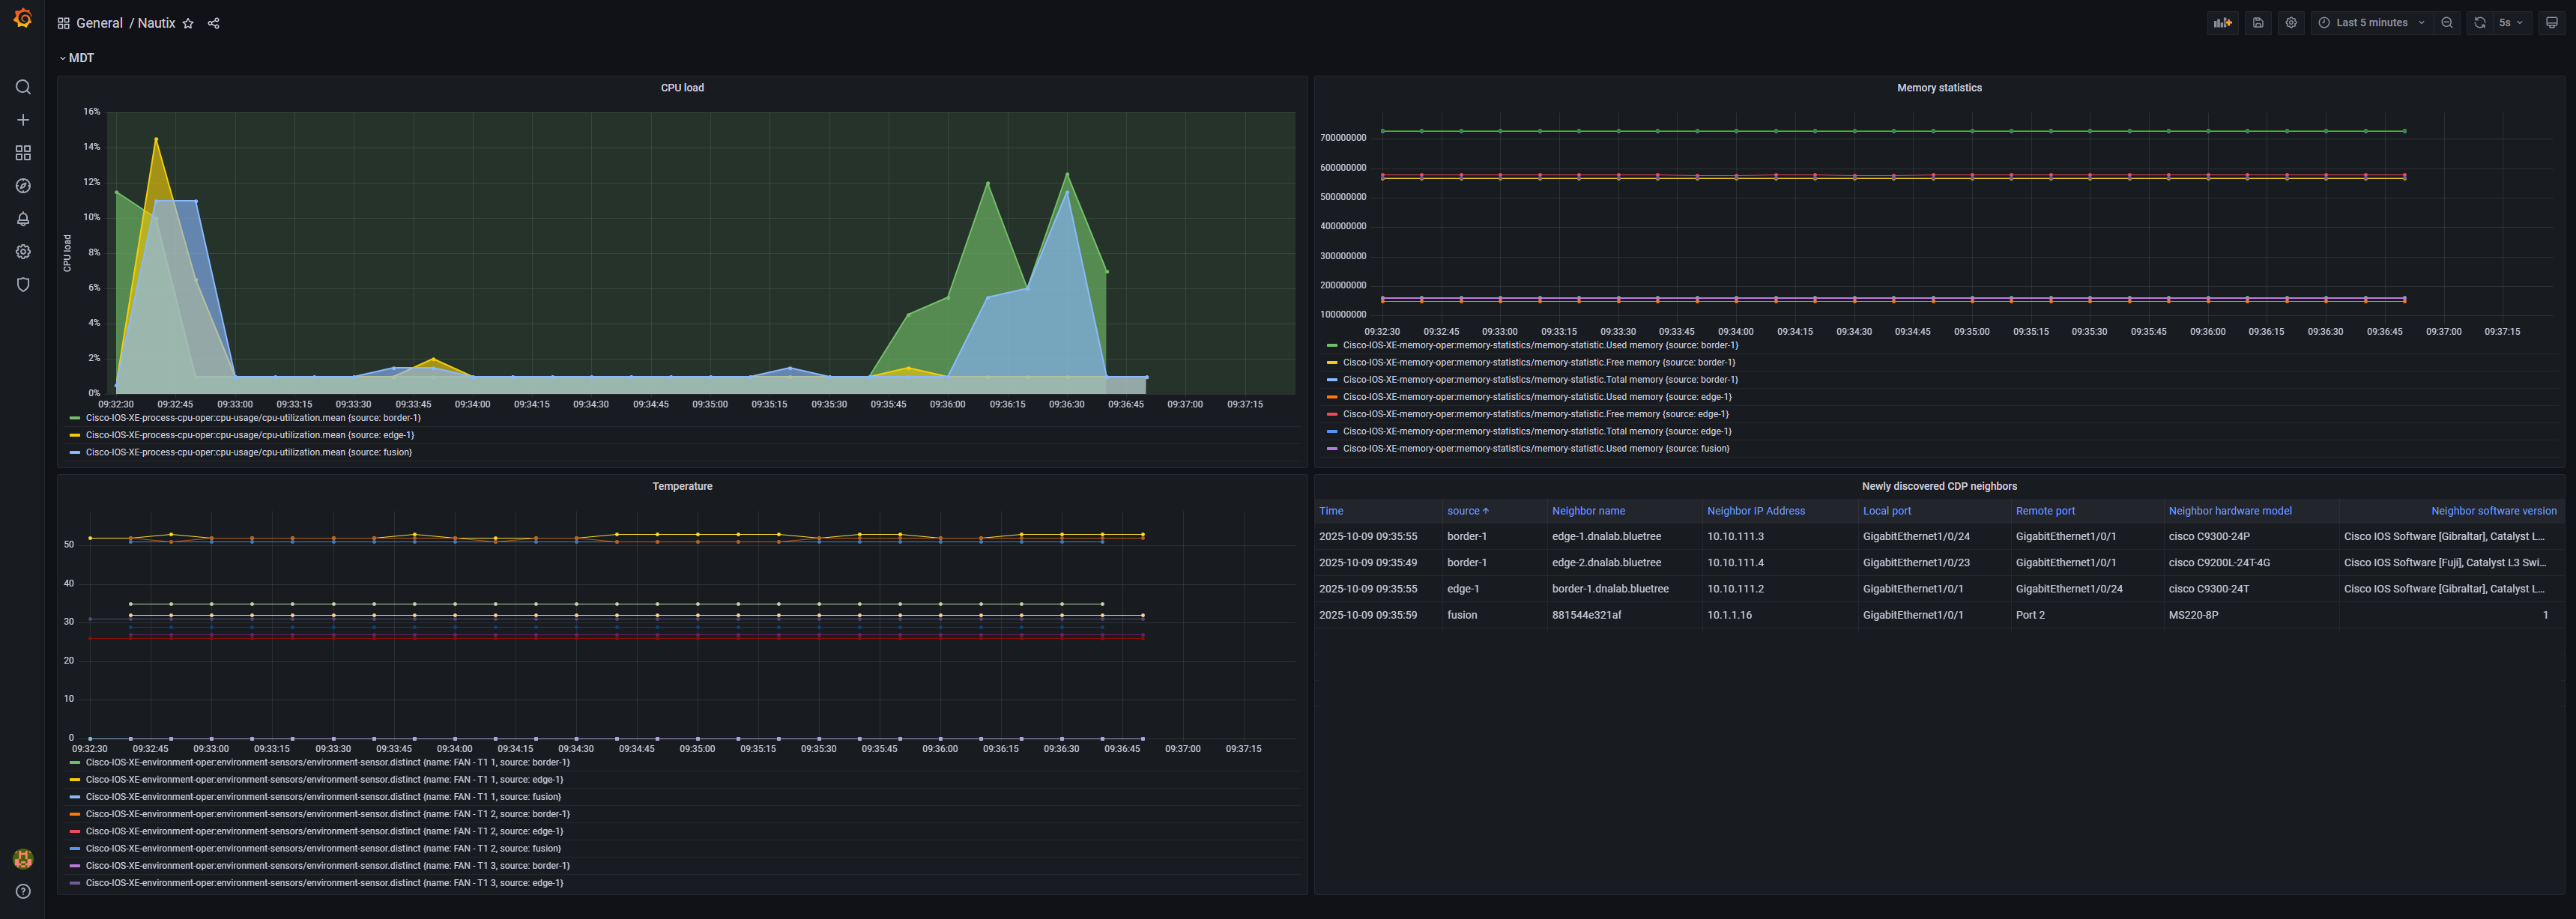
Visualization: Built Grafana dashboard showing device metrics
-
Optimization: Tuned subscriptions with XPath filters, cadence settings, and on-change triggers
Getting Started
Before configuring telemetry on your devices, you need the TIG stack (Telegraf → InfluxDB → Grafana) to receive and visualize the data. Here’s how I set it up locally using Docker Compose.
1. Start the TIG stack
I assume you have already cloned the repository and have done the initial setup as per readme.
In the root of the repositoryrepo, do:
docker-compose up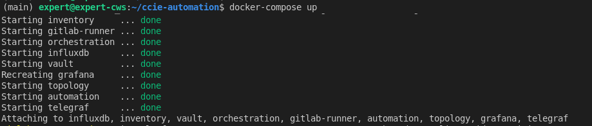
This spins up:
-
InfluxDB – stores telemetry data
-
Grafana – dashboards and visualization
-
Telegraf – optional local agent if needed for transformation or collection
- Other Nautix services
2. Run the Ansible Playbook
Configure telemetry subscriptions on your devices (ensure you have run device discovery first):
-
docker exec -it automation ansible-playbook -i ansible/hosts.yml ansible/configure_telemetry.yml
This playbook:
-
Creates subscriptions using YANG models
-
Configures cadence, on-change triggers, and dial-out streams
-
Points the telemetry data to your InfluxDB instance
3. Check the Telemetry Stream
On the devices, verify subscriptions:
-
show telemetry ietf subscription all
Check that the subscription is connected to Telegraf:
-
show telemetry ietf subscription 1 receiver
4. Visualize in Grafana
- Open Grafana (
http://localhost:3000), login with admin/secret - Add an InfluxDB data source pointing to your InfluxDB container
- Import dashboard:
services/grafana/nautix_dashboard.json - Explore real-time device metrics in the dashboard
Implementation
Here’s the updated folder structure reflecting new or modified files:
📂 services/automation/ansible/
-
configure_telemetry.yml– Ansible playbook to create telemetry subscriptions (new/updated) -
group_vars/discovered.yml– Variables used for telemetry configuration
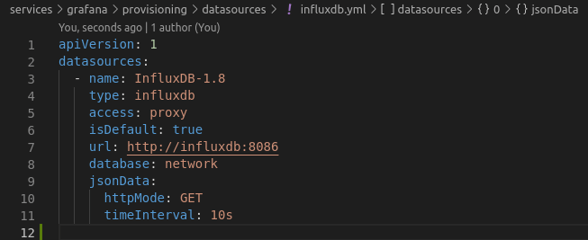
📂 services/grafana/
-
influxdb.yml– Grafana data source configuration for InfluxDB -
nautix_dashboard.json- Exported dashboard
📂 services/telegraf/
-
telegraf.conf– Telegraf configuration
📂 docker-compose.yml – Spins up InfluxDB, Grafana, Telegraf, and rest of the Nautix app
Let’s break it down step by step.
1. Ansible Playbooks
-
configure_telemetry.ymlsets up telemetry subscriptions on Cisco IOS-XE devices using YANG xpath
- Variables in
group_vars/discovered.ymlare used for dynamic configuration
2. TIG Stack
-
Docker Compose starts Telegraf, InfluxDB and Grafana, providing a fully integrated telemetry environment

3. Telegraf configuration
-
Configured via
telegraf.confto parse telemetry streams from devices and forward metrics to InfluxDB
4. Influx DB configuration
-
Set up very basic
Why This Matters
Before, operational data required manual CLI commands or SNMP polling. Now:
✔ Metrics are streamed continuously, reducing lag
✔ On-change subscriptions minimize unnecessary data
✔ Dashboards provide actionable insights at a glance
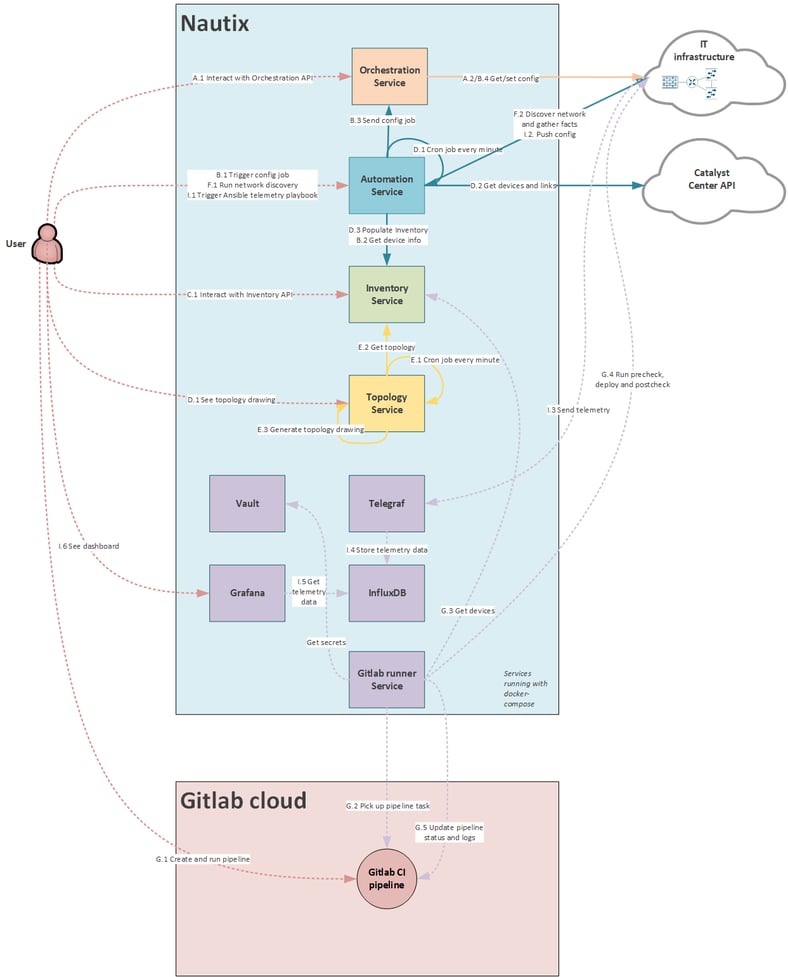
Nautix architecture
Use case "I": Model driven telemetry
- I.1 Trigger ansible playbook to configure telemetry subscription on Cisco IOS XE devices
- I.2 Ansible runs playbook
- I.3 Network devices starts sending telemetry data to Telegraf
- I.4 Telegraf stores the telemetry data to InfluxDB
- I.5 User shows dashboard
- I.6 Grafana polls telemetry data from InfluxDB
- User seeing the telemetry data :)
📅 What’s Next
🔗 Useful Links
- GitLab Repo – My CCIE Automation Code
- Model Driven Telemetry WhitePaper by Cisco
- Ansible documentation
Blog series
- [#1] Intro + Building a Python CLI app
- [#2] Building a Inventory REST API + Docker
- [#3] Orchestration API + NETCONF
- [#4] Automating Network Discovery and Reports with Python & Ansible
- [#5] Building Network Pipelines for Reliable Changes with pyATS & GitLab CI
- [#6] Automating Cisco ACI Deployments with Terraform, Vault, and GitLab CI
[My Journey to CCIE Automation – Week 4] Automating Network Discovery and Reports with Python & Ansible
[My Journey to CCIE Automation #6] Automating Cisco ACI Deployments with Terraform, Vault, and GitLab CI
[My Journey to CCIE Automation #8] Exploring ThousandEyes and Automating Enterprise Agent Deployment